h2. Moving your profiling to the Cloud
For the last couple of years I have been working on an application (EurekaJ - Currently in beta. Final release expected in August 2011) that makes it possible to visualize and alert upon metrics generated by a profiling agent for the JVM. During the process I have looked into a number of technologies and have tried to choose the tools that are most suitable for each part of the design. I started out writing my own Java agent before I discovered BTrace in 2009. BTrace promises to be "a safe, dynamic tracing tool for the Java platform", and I decided to make the switch from my custom developed agent towards BTrace.
To make a cloud-based profiler work properly EurekaJ needs a reliable way to submit data from the java agent to the server-side manager application (EurekaJ.Manager), while still making sure that the agent does not cause too much load on the application being monitored, especially if the data is going to be tranferred accross the network to a remote host.
In the EurekaJ Architecture the BTrace agent will log its tracing output to a set of rotated files on the filesystem, while a small proxy application will parse these files and transfer its contents to the remote manager application.
EurekaJ Manager currently stores its data using an embedded key-value database where the data is stored on the local filesystem (Berekely DB JE). Now, I still wanted to be able to deploy and run EurekaJ Manager in this mode for installations where EurekaJ Manager needs to be located on the local internal network. In addition I also wanted a "Cloud mode" where EurekaJ could store its data in a key-value database that lived in the Cloud. I started looking at Amazons SimpleDB, a key/value based cloud storage option, and came pretty far along the path in implementing SimpleDB storage as a plugin to EurekaJ Manager before realizing that what I needed wasn't a new database, but a reliable and scalable cloud-based filesystem with a low latency. Luckily Amazon offers just that too, the Amazon Elastic Block Store (EBS).
h3. The Profiling Architecture
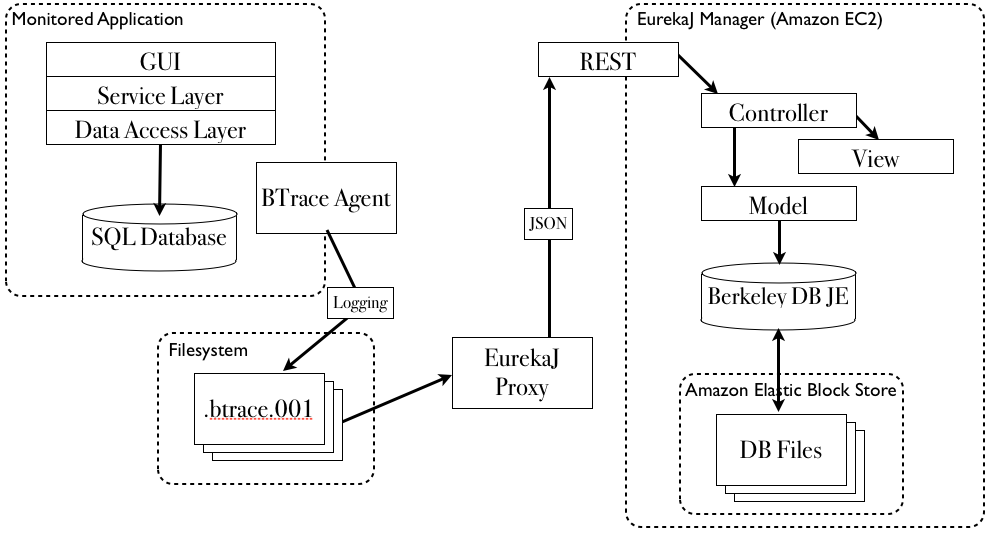
The profiling architecture consists of 4 main parts that needs to be in place in order to work:
* The application being monitored
* The BTrace Java agent - Tracing application metrics and logging these to the local filesystem
* The EurekaJ Proxy - Parsing BTrace tracelogs and passing the metrics along to EurekaJ Manager
* The EurekaJ Manager - Collecting the metrics, analysing, visualising and alerting upon those metrics
The only real difference between running EurekaJ Manager on a local server on the LAN and running it on Amazon Elastic Compute Cloud (EC2), is the fact that we are utilizing the Amazon Elastic Block Store, a safe, reliable, persistent and low latency filesystem, which is the key to be able to scale the number of metrics a single instance of EurekaJ Manager can handle.
The application being monitored is set up with a -javaagent option in the JAVA_OPTS variable, specifying where the BTrace agent is located, along with extra parameters for the agent. For more information on the exact setup, visit the EurekaJ documentation: http://eurekaj.haagen.name/documentation/configuring_btrace.html. The setup for EurekaJ Proxy and EurekaJ Manager is also available in the EurekaJ Deocumentation: http://eurekaj.haagen.name/documentation/configuring_eurekaj_proxy.html and http://eurekaj.haagen.name/documentation/setting_up_eurekaj_manager.html.
A bit more information regarding running Berkeley DB JE on the EBS can be found at Charles Lamb's blog post: http://blogs.oracle.com/charlesLamb/entry/berkeley_db_java_edition_and_a_2.
h3. Configuration in the Cloud
The EurekaJ Profiler is configured to run on an Amazon EC2 small instance. This instance comes with 1.7GB of memory and 1 CPU (as per May 2011), which is more than enough to run and execute both EurekaJ Manager with the BTrace agent and EurekaJ Proxy. The reason I am instrumenting EurekaJ Manager itself is because I wanted to be able to monitor the health of the monitoring application as well, in order to be proactive in case the application needed to scale out with regards to either memory or CPU.
After creating a new 32 bit EC2 small instance via the Amazon AWS control-panel, I needed to add extra EBS storage space to the EC2 instance. The standard EC2 instance comes with a preconfigured 8GB EBS image, but I wanted to increase this to 20 GB. Also via the EC2 control panel, I created a new EBS with 20GB of storage and attached this to the EC2 instance running EurekaJ Manager. After assigning the EBS to the EC2 intstance, I also needed to format the EBS and mount it somewhere on the EC2 filesystem, I decided that /mnt/ed-20110517 would be a suitable directory to store the EurekaJ data.
DO NOT simply copy and paste the text below. Make sure that you are using the correct device, so that you do not format the wrong EBS!
mkfs.ext3 /dev/sdh #This was the 20GB EBS created for EurekaJ Datasudo mkdir /mnt/ed-20110517 #Creating a new directory to hold the EurekaJ Datasudo mount -t ext3 /dev/sdh /mnt/ed-20110517 #Mounting the EBS device to the directory created abovesudo mkdir /mnt/ed-20110517/eurekaj_data
sudo chown ec2-user:ec2-user /mnt/ed-20110517/eurekaj_data #Make sure that the eurekaj_data directory is readable and writable by the ec2-user
Finally, I needed to tell EurekaJ Manager where to put its datam which is configured in the ~/eurekaj/config.properties file:
The above configuration tells EurekaJ Manager to run listening on port 8080, on the default context root (/), as well as where to find and store the Berkeley DB JE database.
h3. Making everything start up at boot
There are many ways to make an application load at boot. I chose a rather naive way for this setup, but you might want to perform the application launch differently on your system.
Since EurekaJ Manager lives in /home/ec2-user/eurekaj and EurekaJ Proxy lives in /home/ec2-user/eurekajproxy, I added the following three lines to /etc/rc.local to make the application start at boot:
The last iptables-line is a simple way to redirect traffic from port 80 to the port EurekaJ Manager listens to, port 8080.
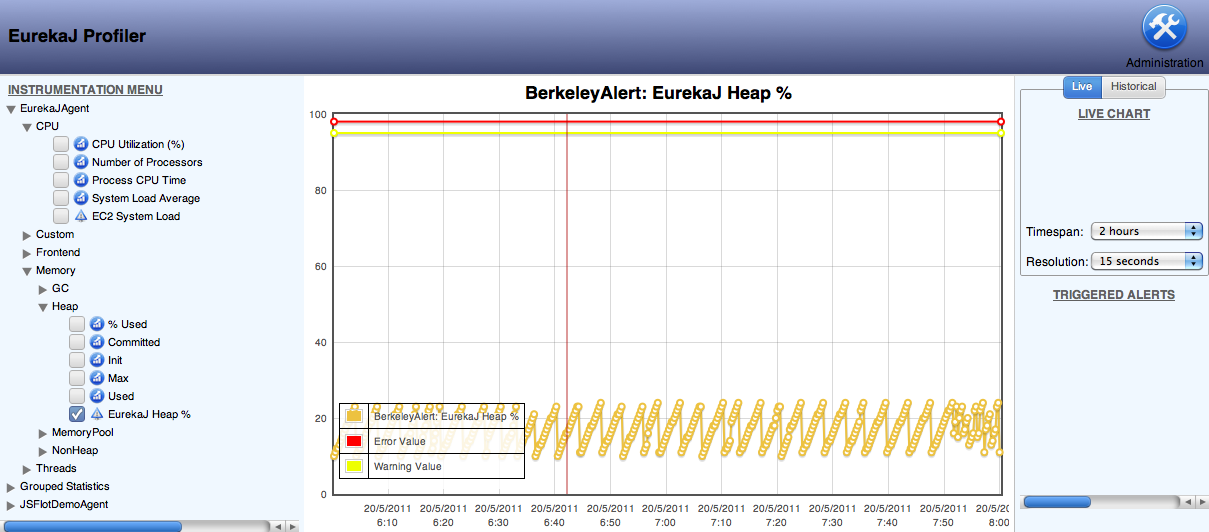
h3. The Result
EurekaJ Manager is now configured and installed and made able to listen on port 80 on the Amazon EC2 instance. I set up an elastic IP address for the server, and redirected the domain name http://eurekaj-ec2.haagen.name. to it. Here, you are able to log in using the username "user" and the password "user" to view and play with the end result. Currently EurekaJ Manager will accept any incoming traffic to http://eurekaj-ec2.haagen.name/liveStatistics, as the security is turned off for incoming statistics at the moment. This will be fixed during the beta-stage of EurekaJ. I also redirected the BTrace output from another application, the JSFlot Demonstration application. The JSFlot demonstration application is running on its own MacMini, outside of Amazons AWS network.
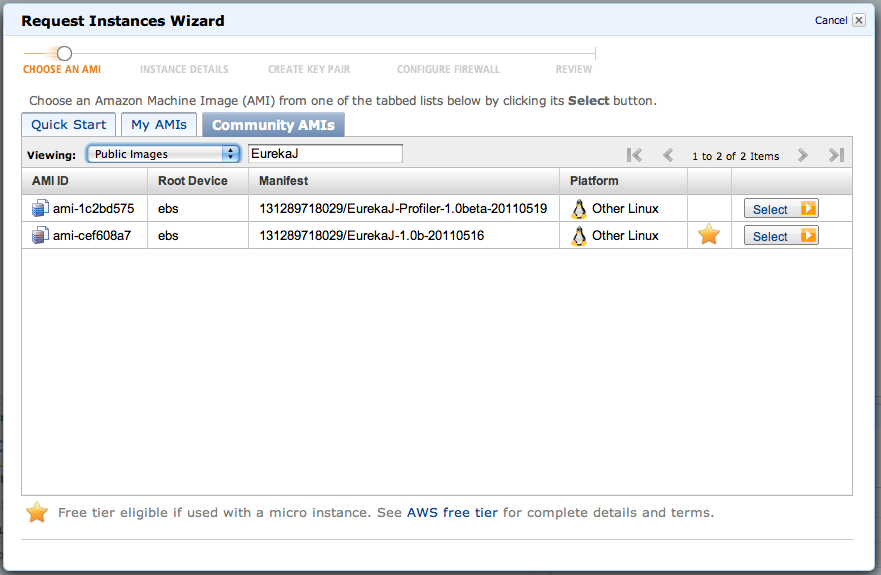
h3. Amazon Machine Image for EurekaJ
I have decided to make AMIs available for the configuration above. The AMI created for this blog post is called EurekaJ-Profiler-1.0beta-20110519, and is available to load from the Amazon Launch Instance control panel:
h3. Downloading EurekaJ
If you wish to download and install EurekaJ yourself, EurekaJ can be downloaded from here: http://eurekaj.haagen.name/download.html.
h3. And the cost ?
As everything here is Free and Open Source Software (FOSS), the cost is limited to only the cost of the Amazon EC2 instance. I would estimate the total monthly cost for running EurekaJ on an EC2 small instance to be roughly 65-70 USD per month, or about USD 25-30 if you run on a reserved instance.


 The only real difference between running EurekaJ Manager on a local server on the LAN and running it on Amazon Elastic Compute Cloud (EC2), is the fact that we are utilizing the Amazon Elastic Block Store, a safe, reliable, persistent and low latency filesystem, which is the key to be able to scale the number of metrics a single instance of EurekaJ Manager can handle.
The application being monitored is set up with a -javaagent option in the JAVA_OPTS variable, specifying where the BTrace agent is located, along with extra parameters for the agent. For more information on the exact setup, visit the EurekaJ documentation: http://eurekaj.haagen.name/documentation/configuring_btrace.html. The setup for EurekaJ Proxy and EurekaJ Manager is also available in the EurekaJ Deocumentation: http://eurekaj.haagen.name/documentation/configuring_eurekaj_proxy.html and http://eurekaj.haagen.name/documentation/setting_up_eurekaj_manager.html.
A bit more information regarding running Berkeley DB JE on the EBS can be found at Charles Lamb's blog post: http://blogs.oracle.com/charlesLamb/entry/berkeley_db_java_edition_and_a_2.
h3. Configuration in the Cloud
The EurekaJ Profiler is configured to run on an Amazon EC2 small instance. This instance comes with 1.7GB of memory and 1 CPU (as per May 2011), which is more than enough to run and execute both EurekaJ Manager with the BTrace agent and EurekaJ Proxy. The reason I am instrumenting EurekaJ Manager itself is because I wanted to be able to monitor the health of the monitoring application as well, in order to be proactive in case the application needed to scale out with regards to either memory or CPU.
After creating a new 32 bit EC2 small instance via the Amazon AWS control-panel, I needed to add extra EBS storage space to the EC2 instance. The standard EC2 instance comes with a preconfigured 8GB EBS image, but I wanted to increase this to 20 GB. Also via the EC2 control panel, I created a new EBS with 20GB of storage and attached this to the EC2 instance running EurekaJ Manager. After assigning the EBS to the EC2 intstance, I also needed to format the EBS and mount it somewhere on the EC2 filesystem, I decided that /mnt/ed-20110517 would be a suitable directory to store the EurekaJ data.
DO NOT simply copy and paste the text below. Make sure that you are using the correct device, so that you do not format the wrong EBS!
The only real difference between running EurekaJ Manager on a local server on the LAN and running it on Amazon Elastic Compute Cloud (EC2), is the fact that we are utilizing the Amazon Elastic Block Store, a safe, reliable, persistent and low latency filesystem, which is the key to be able to scale the number of metrics a single instance of EurekaJ Manager can handle.
The application being monitored is set up with a -javaagent option in the JAVA_OPTS variable, specifying where the BTrace agent is located, along with extra parameters for the agent. For more information on the exact setup, visit the EurekaJ documentation: http://eurekaj.haagen.name/documentation/configuring_btrace.html. The setup for EurekaJ Proxy and EurekaJ Manager is also available in the EurekaJ Deocumentation: http://eurekaj.haagen.name/documentation/configuring_eurekaj_proxy.html and http://eurekaj.haagen.name/documentation/setting_up_eurekaj_manager.html.
A bit more information regarding running Berkeley DB JE on the EBS can be found at Charles Lamb's blog post: http://blogs.oracle.com/charlesLamb/entry/berkeley_db_java_edition_and_a_2.
h3. Configuration in the Cloud
The EurekaJ Profiler is configured to run on an Amazon EC2 small instance. This instance comes with 1.7GB of memory and 1 CPU (as per May 2011), which is more than enough to run and execute both EurekaJ Manager with the BTrace agent and EurekaJ Proxy. The reason I am instrumenting EurekaJ Manager itself is because I wanted to be able to monitor the health of the monitoring application as well, in order to be proactive in case the application needed to scale out with regards to either memory or CPU.
After creating a new 32 bit EC2 small instance via the Amazon AWS control-panel, I needed to add extra EBS storage space to the EC2 instance. The standard EC2 instance comes with a preconfigured 8GB EBS image, but I wanted to increase this to 20 GB. Also via the EC2 control panel, I created a new EBS with 20GB of storage and attached this to the EC2 instance running EurekaJ Manager. After assigning the EBS to the EC2 intstance, I also needed to format the EBS and mount it somewhere on the EC2 filesystem, I decided that /mnt/ed-20110517 would be a suitable directory to store the EurekaJ data.
DO NOT simply copy and paste the text below. Make sure that you are using the correct device, so that you do not format the wrong EBS!
 h3. Downloading EurekaJ
If you wish to download and install EurekaJ yourself, EurekaJ can be downloaded from here: http://eurekaj.haagen.name/download.html.
h3. And the cost ?
As everything here is Free and Open Source Software (FOSS), the cost is limited to only the cost of the Amazon EC2 instance. I would estimate the total monthly cost for running EurekaJ on an EC2 small instance to be roughly 65-70 USD per month, or about USD 25-30 if you run on a reserved instance.
h3. Downloading EurekaJ
If you wish to download and install EurekaJ yourself, EurekaJ can be downloaded from here: http://eurekaj.haagen.name/download.html.
h3. And the cost ?
As everything here is Free and Open Source Software (FOSS), the cost is limited to only the cost of the Amazon EC2 instance. I would estimate the total monthly cost for running EurekaJ on an EC2 small instance to be roughly 65-70 USD per month, or about USD 25-30 if you run on a reserved instance.